Loading 3D Market Data
Get Jers Matrix Tool Join Telegram Channel

JERS Supply & Demand Matrix

Pine Script v5 Jers Supply & Demand Matrix marking unmitigated institutional order blocks.
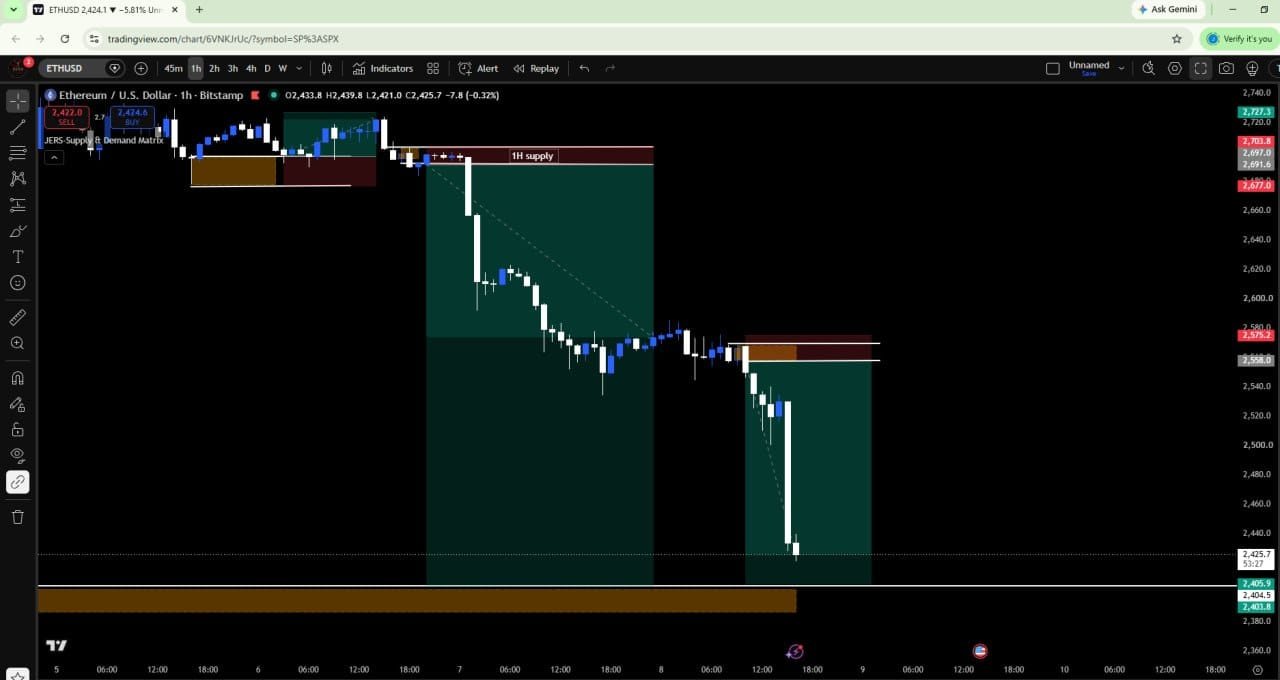
JERS Supply & Demand Matrix on a live ETHUSD 1 hour TradingView chart, marking a 1H supply zone that rejects price into a sustained markdown
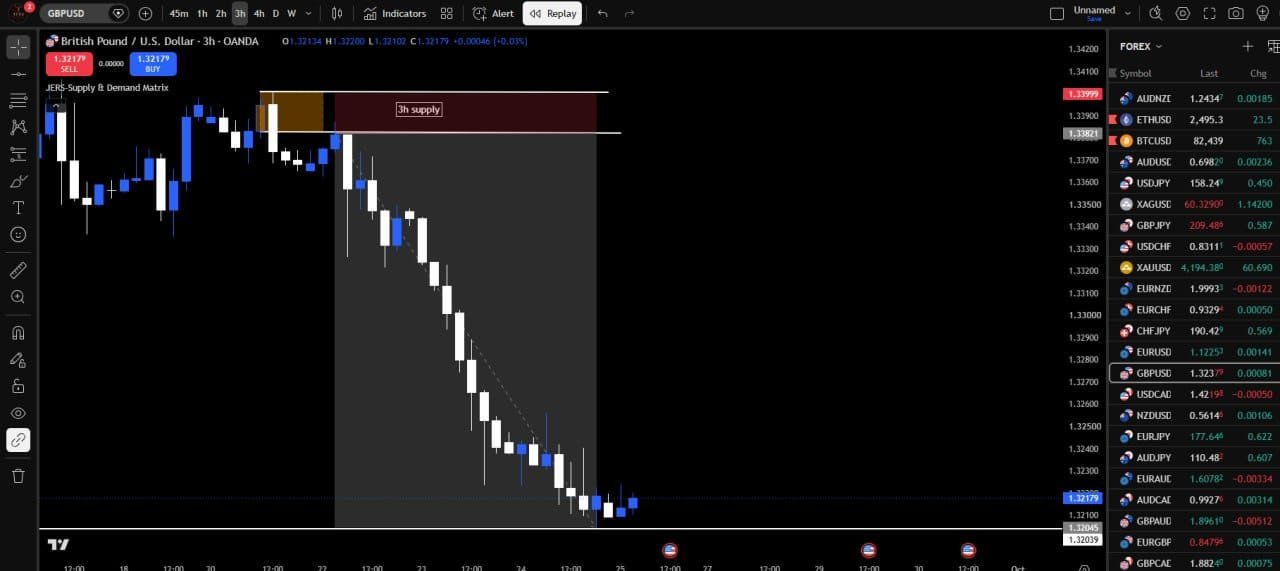
JERS Supply & Demand Matrix on a live GBPUSD 3 hour TradingView chart, flagging a 3H supply zone ahead of an extended downside leg
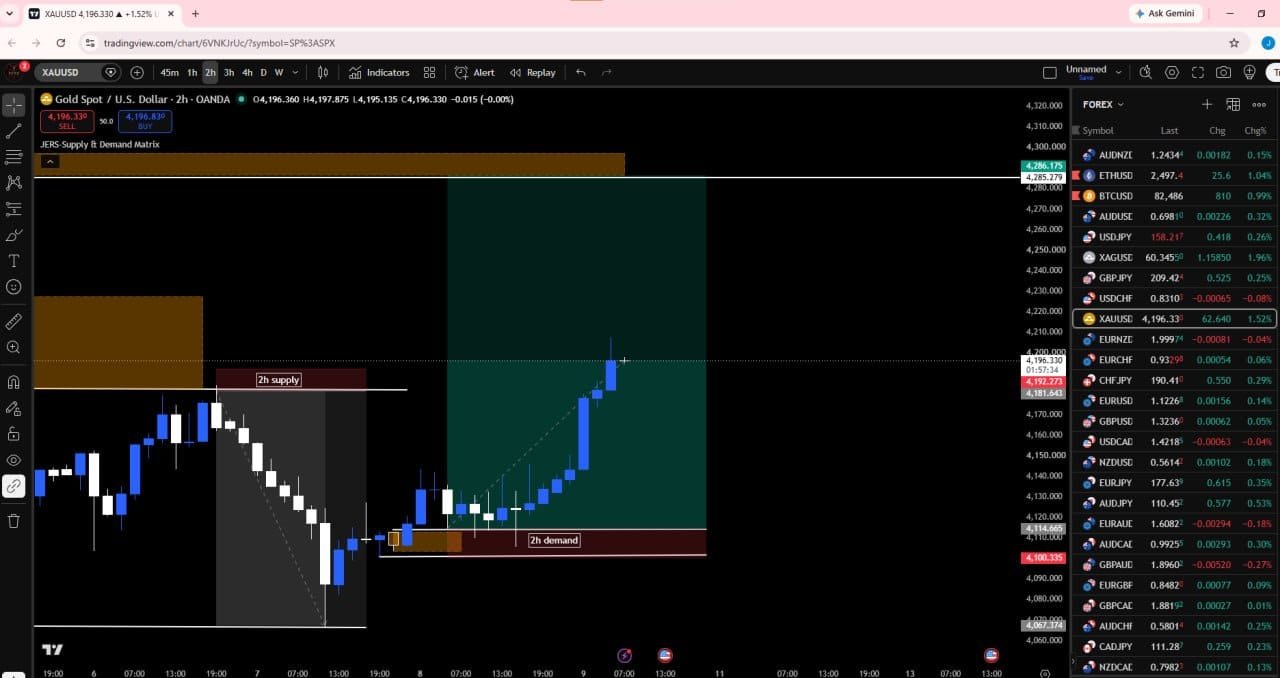
JERS Supply & Demand Matrix on a live Gold XAUUSD 2 hour TradingView chart, showing a 2H demand zone reversing price back into the 2H supply above
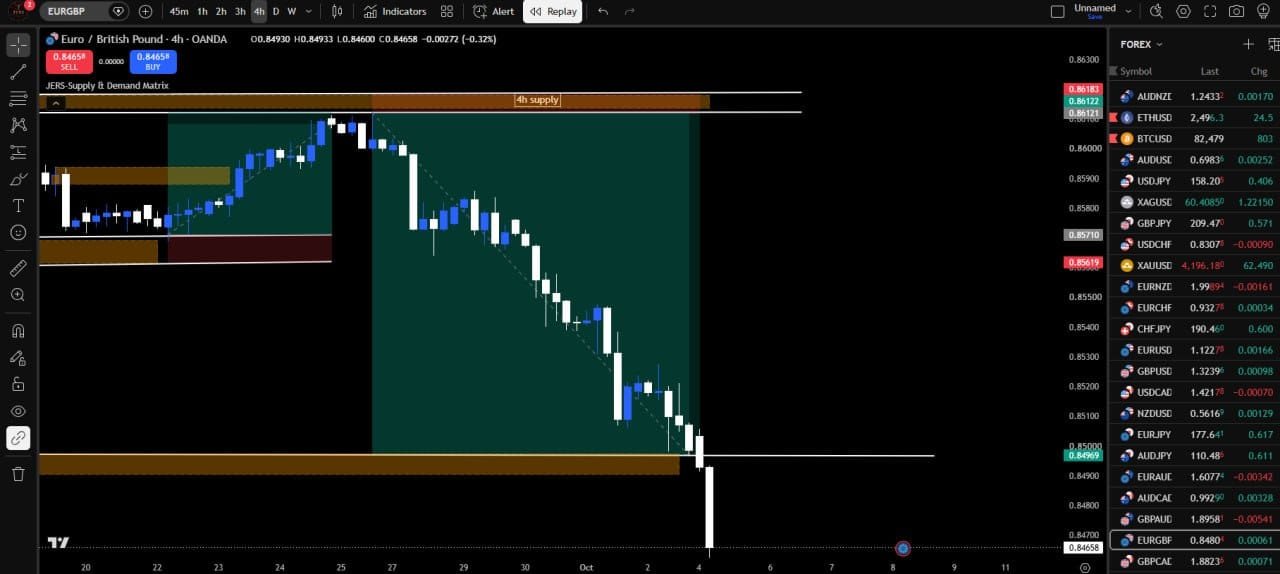
JERS Supply & Demand Matrix on a live EURGBP 4 hour TradingView chart, holding a 4H supply zone through a complete unmitigated downside run
LIVE
Watch & Learn

Verified Live Charts

Real supply and demand setups flagged by the JERS algorithm.

Live ETHUSD 1 hour chart with the JERS Supply & Demand Matrix marking a 1H supply zone and the markdown that followed ✓ ETHUSD 1H • 1:5.2 R:R
Live GBPUSD 3 hour chart with the JERS Supply & Demand Matrix flagging a 3H supply zone ahead of an extended downside leg ⚡ GBPUSD 3H • 1:6.1 R:R
Live Gold XAUUSD 2 hour chart with the JERS Supply & Demand Matrix showing a 2H demand zone reversing price toward the supply above ★ XAUUSD 2H • 1:4.4 R:R
Live EURGBP 4 hour chart with the JERS Supply & Demand Matrix holding a 4H supply zone through a complete downside run ✓ EURGBP 4H • 1:5.7 R:R

Institutional Logic Engine

Mathematical order block detection with zero repainting on TradingView.
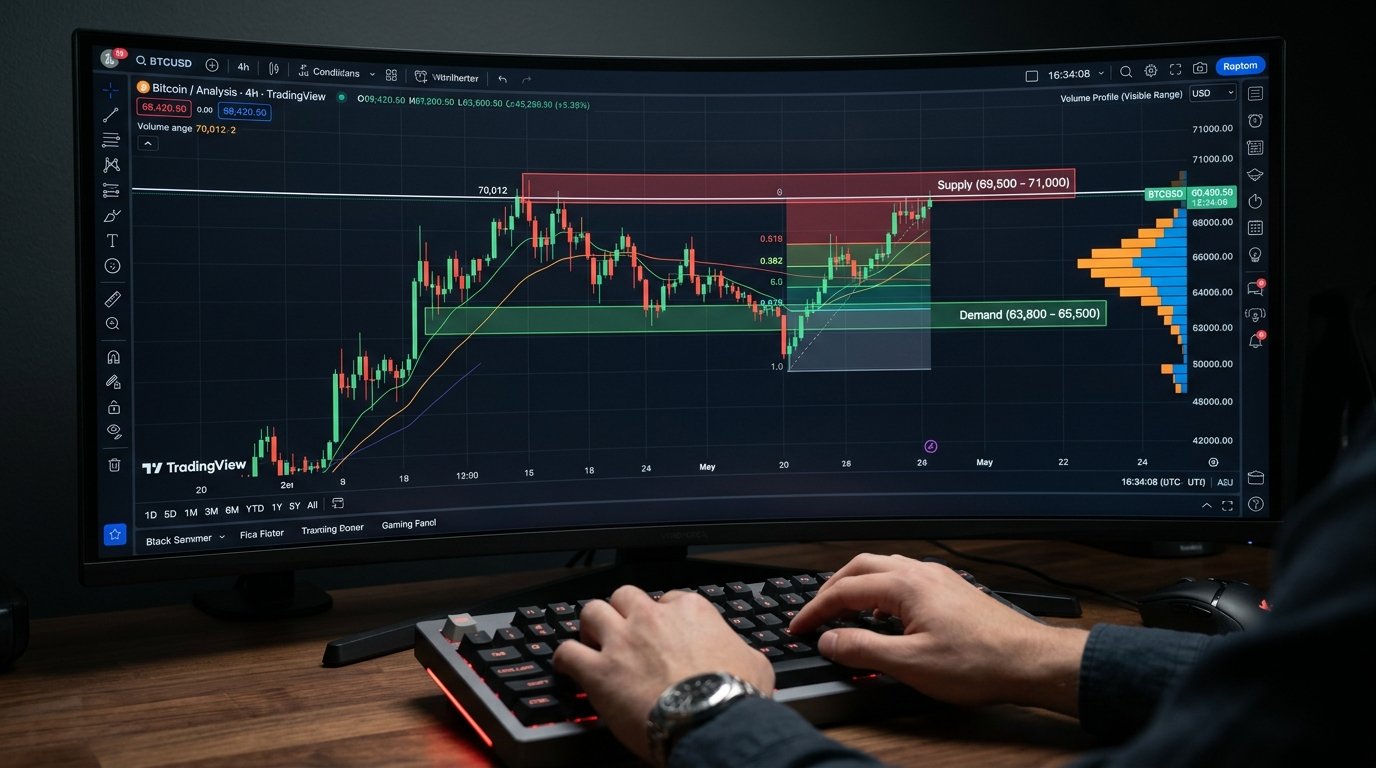
Candlestick chart and volume panel filling a trading screen
Reads the tape, not the lag
Zones derive from candle volume, never from a moving average
Engineer working beside racks in a data centre
Runs on TradingView's servers
Nothing to install, nothing to keep running on your machine
CLOUD

Auto Supply & Demand Zones

Detects institutional volume candles. Automatically draws supply zones (red) at premium and demand zones (green) at discount.

Fresh vs Mitigated Tracking

Tracks whether a zone has been touched or remains virgin. Fresh unmitigated zones offer highest probability entries.

Pure Supply & Demand Only

No noisy lines or clutter. Focuses strictly on genuine institutional supply and demand origin points.

Precision Zone Boundaries

Highlights exact proximal and distal levels where banks entered the market. Free of retail fake signals.

Multi-Timeframe Dashboard

Shows higher timeframe (Daily, H4, H1) institutional trend direction directly on your execution chart.

100% Non-Repainting Logic

Calculated and locked at bar close. Once drawn, zones never repaint, shift, or disappear from charts.

TradingView Native Platform

Accessible anywhere you trade, on web browsers, desktop apps, and mobile devices.

TradingView Web

Runs on Chrome, Safari, Brave across Free, Essential, and Premium accounts.

TradingView Desktop

Optimized for multi-monitor workstations with zero chart lag or memory leaks.

TradingView Mobile App

Manage orders and review live zones on iOS and Android devices.

Order book and candlestick chart running on a trading terminal
Institutional Orderflow Matrix
TradingView Pine Script v5 engine
NON-REPAINT
Trader analyzing pure supply and demand zones across multiple screens
Pure zones mapped across every screen
TradingView Desktop • Web • Mobile
SYNC

Instant Cloud Execution

Computes real-time institutional tick volume directly within TradingView servers.

The instant price taps an unmitigated zone, your chart highlights the reaction level with clean mathematical boundaries.

100%
Zero Repainting
< 45 Mins
Invite Activation

Why Traders Choose JERS

One tool, one mentor and one community — built around pure supply and demand.

Zero Repainting, Ever

Zones lock at bar close. What you see on the chart today is exactly what was printed in real time — no hindsight tricks.

Built & Taught by Jers

8+ years of live supply and demand trading poured into one tool — and the person who built it teaches you how to use it.

Clean Charts, No Clutter

No signal spam or twenty overlapping lines. Just fresh institutional zones, liquidity levels and structure you can actually read.

Learning Vault Included

Step-by-step videos, PDFs and strategy breakdowns so you understand why a zone works, not just where it is.

Live Market Support

Daily analysis, key levels and live Q&A during market hours — you are never left alone with the chart.

Fast Activation

Share your TradingView username after payment and the invite-only script is added to your account quickly — works on web, desktop and mobile.

Select Your Plan

Activate the Jers Supply & Demand Matrix on your TradingView account today.

1 Year Membership

Build skills. Gain access. Trade smarter.

£ 349 / one year
  • Jer’s Supply & Demand MatrixAdvanced S&D tool with real market zones, liquidity levels & structure mapping.
  • Video Learning VaultStep-by-step video courses, PDFs, trade setups and strategy breakdowns.
  • Discord Community AccessReal traders. Real discussions. No fake hype.
  • Live Market SupportDaily analysis, key levels and live Q&A sessions during market hours.
  • Trade DirectionsHigh-probability setups, key zones and trade ideas shared directly.

Invest in your trading journey.

Simple Process

How To Use Jers Matrix Tool

Start using the Jers Supply & Demand Matrix in three simple, seamless steps.

01

Choose Your Membership Plan

Pick the 1 Year or Lifetime membership that suits your trading goals and complete the secure payment.

Secure Payment View Plans
02

Share Your TradingView Username

After payment you are taken to our support team. Simply share your TradingView username so we can activate your access.

Quick Activation Contact Support
03

Access Jers Matrix on TradingView

Open TradingView → Indicators → Invite-only scripts. You will find the Jers Supply & Demand Matrix ready to add to any chart.
Web • Desktop • Mobile Need Help?
Enlarged indicator chart preview